GA4 for Beginners (2026): What to Track and How to Read Reports

If you’re just getting started with Google Analytics 4 (GA4), the amount of change compared with Universal Analytics can feel overwhelming. GA4 is more than just an upgrade it’s a completely new analytics platform built around an event‑based data model, cross‑device tracking and privacy‑focused reporting.
In July 2023, Universal Analytics stopped processing data, and since then GA4 has been the default analytics tool. With new features in 2026 such as automatic insights on the home page and cross‑channel budgeting, now is the time to master GA4.
This guide explains the key concepts, shows you what to track, and teaches you how to read the most important reports.
What Actually is GA4?
It is Google’s web and app analytics platform. It helps you track what people do on your site or app, like page views, clicks, form submissions, purchases, and where visitors came from.
The big idea is simple: GA4 records actions as events. That makes it easier to measure user behaviour, engagement, and conversions in one place.
In plain terms, GA4 helps you answer questions like:
- How many people visited?
- Where did they come from?
- What pages did they view?
- Did they sign up, contact you, or buy?
It is the version that replaced Universal Analytics.
How GA4 Differs from Universal Analytics
Universal Analytics organised data around sessions and pageviews. GA4 shifts to an event‑based model where every user interaction (including pageviews) is tracked as an event. This approach allows GA4 to capture interactions across websites and mobile apps in a single property and gives you more granular control over what is measured. GA4 also introduces enhanced measurement for interactions like scrolls, site search and video engagement; these events are collected automatically.
Other major differences include:
- User identification changes. In GA4 you can combine identifiers such as User ID, Google Signals and Device ID to measure users across devices. GA4’s default primary user metric is Active Users (unique users who logged an event), while Total Users counts all users who triggered any event.
- New engagement metrics. Instead of bounce rate, GA4 focuses on engagement. An engaged session lasts longer than 10 seconds, includes a conversion event or at least two page/screen views. The engagement rate is the percentage of sessions that are engaged, and the bounce rate is the inverse.
- Event and parameter model. GA4 events can carry parameters that provide additional context. This model lets you use the same metrics and dimensions across websites and apps and automatically track interactions like scrolls and outbound clicks.
- Unlimited conversions. Goals in Universal Analytics were limited (20 per view). In GA4 any event can be marked as a conversion, and there is no cap on the number of conversion events you can track.
- Privacy features and data retention. GA4’s default data retention is two months but can be extended to 14 months. Built‑in privacy controls include consent mode and data deletion tools, helping businesses comply with regulations like GDPR and CCPA.
- Cross‑platform and better attribution. GA4 connects website and app sessions to provide a complete customer journey and offers sophisticated attribution models. For businesses operating across multiple devices, this means seeing how marketing channels influence conversions.
2026 Updates You Should Know
Google continues to roll out new features. In February 2026 GA4 introduced Generated insights, which highlight the top data changes since your last visit and surface anomalies or configuration updates. Google also launched a cross‑channel budgeting beta that helps marketers plan and optimise paid media spend by projecting how channels will perform against KPIs like conversions and revenue. These updates signal Google’s ongoing focus on AI‑powered insights and advanced budgeting capabilities.
Setting Up GA4: Data Streams and Measurement ID
Before tracking anything, you need to create a GA4 property and a data stream (web or app). Each data stream has a Measurement ID (format G‑XXXXXXXXXX) that identifies where data should be sent. Use this ID when configuring tags in Google Tag Manager (GTM).
Data Streams
A data stream is the source of data inside GA4. It is how GA4 knows where your user activity is coming from.
Measurement ID
A Measurement ID is the unique code for a GA4 web data stream. It usually starts with G- followed by letters and numbers.
Installation steps:
- Create a GA4 property. In the Google Analytics admin section, click Create Property and choose GA4 property. Specify your time zone (e.g., Asia/Karachi) and currency.
- Create a data stream. Select Web and enter your site URL. GA4 generates a Measurement ID – copy this value.
- Set up GA4 in GTM. In Google Tag Manager go to Tags → New → Google Tag and paste the Measurement ID. Set the trigger to Initialization – All Pages so the tag fires as soon as possible.
- Publish and test. Enable GTM preview mode and check the GA4 DebugView to verify that events are being recorded. The DebugView shows events in real time when the debug mode is enabled via a Chrome extension, the debug_mode parameter or GTM preview.
Pro Tip: If you lose the Measurement ID or data stream settings, navigate to Admin → Data Streams, select your stream and copy the ID again.
The Event & Parameter Model: What to Track
The core of GA4 is its event and parameter model. Every user interaction is an event; events can have parameters (e.g., page_location, link_url) that describe details. This model is more flexible than the old sessions/pageviews model because it allows unified tracking across websites and apps and automatically records common interactions.
Categories of Events
- Automatically collected events. These events fire when you install GA4 and include page views, session starts and first visits. They provide basic data without any extra setup.
- Enhanced measurement events. Enabled by default (but configurable), these events capture interactions such as scrolls, outbound link clicks, site search, video engagement, file downloads and form submissions. GA4 aims to reduce manual tag creation, but there are limitations: only scrolls past 90 % are tracked, form submission detection can be unreliable and YouTube tracking requires additional parameters. If you need more detail (e.g., scroll at 25 %, 50 %), configure custom tracking in GTM.
- Recommended events. Google provides event names for common business activities like sign_up, purchase or view_item. Adding these events (with specified parameters) enriches reports and unlocks ecommerce and advertising features.
- Custom events. Define your own events to capture unique interactions (e.g., newsletter_signup, video_share). When you create a custom event, ensure it follows Google’s naming conventions (lowercase, spaces replaced with underscores) and use descriptive parameters. You can mark custom events as conversions.
Why Events and Parameters Matter
The event and parameter model allows you to:
- See integrated data across the web and app. Because events and parameters are used consistently across platforms, you can compare user behavior across websites and mobile apps in a single GA4 property.
- Track unlimited conversions. Conversions are simply events flagged as key events; there’s no 20‑goal limit as in UA.
- Build detailed remarketing audiences. Events and parameters enable granular audience definitions based on behaviors like scrolling, file downloads or video plays.
Conversions and Key Events
In GA4, a conversion is any event that represents a business objective: purchase, form submission, account creation, etc. You can mark an existing event as a conversion or create a new conversion event. GA4 counts every instance of a conversion event by default, but as of April 2023 you can change the counting method to once per session. Two related metrics are worth understanding:
- Session Conversion Rate. The percentage of sessions that included at least one conversion event.
- User Conversion Rate. The percentage of users who triggered any conversion event.
To set up a conversion:
- Send or configure the event via GTM or GA4.
- In GA4, go to Admin → Conversions, click New Conversion Event and enter the event name. From that point onward, the event will appear in conversion reports.
Understanding GA4 Metrics and Dimensions
GA4 introduces several new metrics and modifies existing ones. Here are the key metrics you should know:
| Metric | What it measures | Notes |
|---|---|---|
| Active Users | Distinct users who triggered an event | Replaces Total Users as the primary user metric. |
| Total Users | Unique users who logged any event | Useful for historic comparisons with UA. |
| New Users | Users who interacted for the first time | Triggered by first_visit or first_open. |
| Engaged Sessions | Sessions lasting > 10 s, containing a conversion event or at least two page/screen views | GA4’s replacement for bounce rate. |
| Engagement Rate | Engaged sessions divided by total sessions | Inverse of bounce rate. |
| Average Engagement Time | Average time users spend actively engaged with your site or app | Ignores time when the page/tab is not in focus. |
| Views | Total number of app screens and web pages viewed | Equivalent to UA pageviews. |
| Views per Session | Number of screen/page views per session | Helps assess engagement depth. |
Debugging and Quality Assurance
Testing your implementation is crucial. GA4 includes a DebugView that shows events in real time when debug mode is enabled. You can enable debug mode by:
- Install the GA Debugger Chrome extension and switch it on.
- Adding a debug_mode parameter to events.
- Using GTM Preview mode. When previewing a container, GTM automatically sets debug_mode to true, and your events appear in DebugView.
In DebugView, click on each event to see its parameters and verify that values are passed correctly. If events do not appear, refresh the DebugView and confirm you’ve selected the correct debug device.
Reading GA4 Reports
GA4 organises reports around the customer lifecycle: Acquisition, Engagement, Monetization, and Retention. There are also Realtime and Advertising (attribution) reports. Understanding these reports helps you interpret your data and identify opportunities.
1. Realtime Report
The Realtime report shows what’s happening on your site or app right now: current users, their locations, traffic sources, and events. Unlike Universal Analytics’ basic view, GA4’s real-time report lets you analyse segments of users based on country, device or source. During a product launch or marketing campaign, monitor real‑time events (e.g., form submissions, purchases) to see immediate effects.
2. Acquisition Reports
Acquisition reports answer the question “How do users find you?” GA4 splits acquisition into User Acquisition (first traffic source) and Traffic Acquisition (source of sessions). You can see which channels (organic search, paid search, social, email, referral) drive the most users and conversions. The Acquisition overview shows high‑level metrics, while detailed reports allow you to drill down by medium or campaign. Use this data to allocate marketing budget and test new channels. For example, AgencyAnalytics notes that GA4 helps you highlight organic search performance and paid search ROI for local businesses.
3. Engagement Reports
Engagement reports focus on what users do. The Events report lists events by count, users and event value. You can click into individual events to see parameters like page_location or link_url. The Pages and screens report shows engagement time and views per page or screen, helping you identify content that keeps users hooked. The Engagement overview highlights the engagement rate, average engagement time and conversions.
4. Monetization Reports
For e-commerce and monetised content, GA4’s Monetization reports track revenue, e-commerce purchases and in‑app purchases. The E-commerce purchases report displays items purchased, quantity and revenue. Set up recommended ecommerce events (e.g., begin_checkout, purchase) to populate these reports. GA4’s unlimited conversions and rich parameters make it easier to analyse sales funnels.
5. Retention Reports
Retention reports measure how well you keep users coming back. The Retention overview shows returning users and retention cohorts over time. Pair retention data with Monthly Active Users to see long‑term growth. This is particularly useful for subscription services or apps.
6. Advertising & Attribution Reports
GA4 provides improved attribution modelling and cross‑platform reporting. The Conversion Paths report analyses how different channels contribute to conversions. New 2026 features like Conversion attribution analysis (beta) let you see assisted conversions and refined funnel analysis, identifying which early‑funnel channels (e.g., YouTube) drive interest. GA4 also allows channel‑level budgeting to forecast ROI.
Customizing Reports
GA4’s default reports may not answer every question. The Reports Library lets you duplicate standard reports or build custom ones tailored to your business. AgencyAnalytics recommends using snapshots to create saved views that highlight key metrics. You can filter reports by location (e.g., Karachi users), device category or landing page to uncover specific insights.
Advanced Features
Cross‑Domain Tracking
If your business spans multiple domains (e.g., example.com and shop.example.com), enable cross‑domain tracking so GA4 recognises users across domains. GA4 uses first‑party cookies tied to a single domain, so without configuration, user journeys appear fragmented. To implement cross‑domain tracking, pass the _gl parameter in URLs; GA4 then stitches sessions across domains.
BigQuery Export
One of GA4’s biggest advantages is its free connection to BigQuery, previously reserved for GA360 customers. By exporting raw event data to BigQuery, you can perform advanced queries without sampling issues and connect GA4 data to other platforms. BigQuery integration also enables richer visualisations in tools like Looker Studio, Tableau, Power BI or Qlik.
Predictive Metrics and Audiences
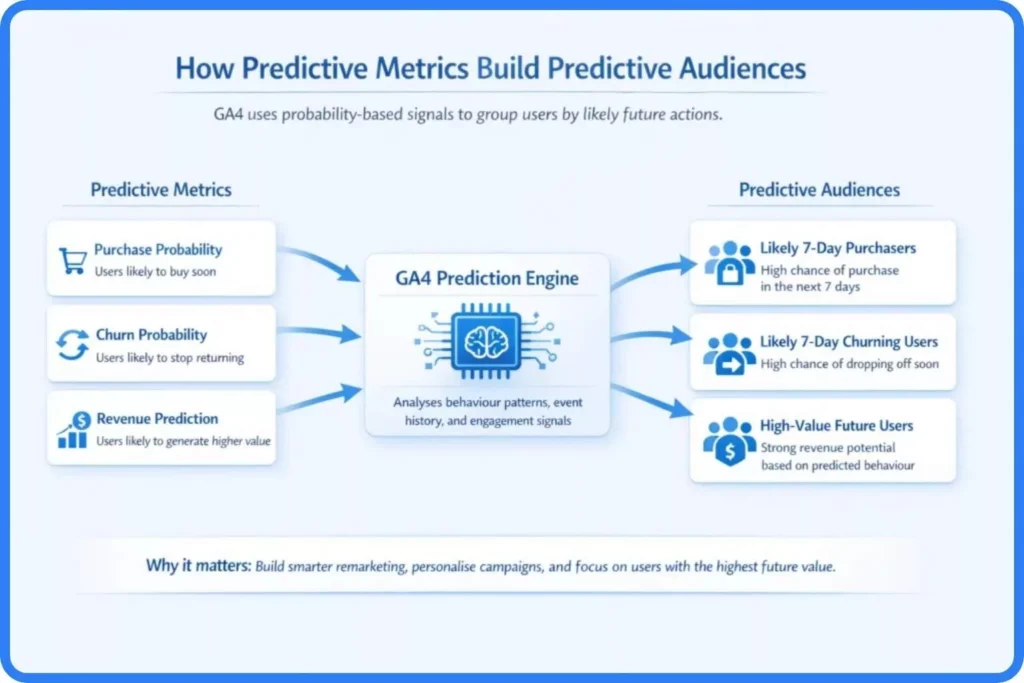
GA4 incorporates machine‑learning‑based predictive metrics. Purchase probability, churn probability, and revenue prediction estimate user behaviours in the next seven days. These metrics power predictive audiences (e.g., “likely 7‑day purchasers”) that automatically group users likely to convert. You can use predictive audiences in remarketing campaigns or to personalise experiences. While still nascent, predictive insights help you focus on users with the highest potential.
Best Practices & Pro Tips
- Plan your event structure. Before implementing GA4, map out the key interactions you need to track and assign intuitive event names and parameters. A clear naming convention makes reporting much easier.
- Customise enhanced measurement. Disable enhanced measurement events you intend to track manually via GTM to avoid duplicate data and unreliable form tracking.
- Enable Google Signals. Activating Google Signals allows cross‑device reporting and demographic data (age, gender, interests). Use this feature responsibly and ensure your privacy policy informs users.
- Set data retention to 14 months. Adjust the data retention setting from the default 2 months to 14 months to maintain historical data for longer analyses.
- Mark key events as conversions. Track unlimited conversions and evaluate both session and user conversion rates. Conversions unlock deeper insights in advertising and funnel reports.
- Use DebugView regularly. Test your tags after any change. If events don’t appear, enable the GA Debugger extension or GTM preview and confirm debug_mode is set to true.
- Link GA4 with Google Ads. Integrating GA4 with Google Ads allows you to import conversion events and build remarketing audiences. GA4’s event‑based model lets you define audiences based on scrolls, downloads and other interactions.
- Leverage BigQuery and Looker Studio. Export data to BigQuery for unsampled analysis and connect to Looker Studio (formerly Data Studio) for customised dashboards.
- Explore predictive insights. Experiment with predictive metrics and audiences to identify users likely to purchase or churn.
Conclusion and Next Steps
GA4’s event‑based architecture, cross‑platform tracking, and machine‑learning insights make it a powerful tool for modern analytics. By understanding what to track (automatically collected, enhanced measurement, recommended and custom events) and learning how to read reports, you can unlock actionable insights into how people find, interact with and convert on your website or app. Use this guide to set up your property, configure key events, and explore advanced features like BigQuery export, cross‑domain tracking and predictive metrics.
Ready to take your analytics further? Contact our consultants at Wide Ripples Digital to get a customised implementation plan. With GA4’s continuous updates, such as generated insights and cross‑channel budgeting, staying informed will help you get the most from your data.
Quick FAQs
Is GA4 free?
Do I need coding skills to set up GA4?
How do I migrate from Universal Analytics to GA4?
How long does data appear in GA4?
Where is the bounce rate?
Why don’t I see my events?
Can GA4 track multiple domains?
What are predictive metrics and audiences?
Disclaimer: The information provided in this blog is for general informational purposes only. For professional assistance and advice, please contact experts.
Written by Neha Ghauri
Last updated April 13, 2026