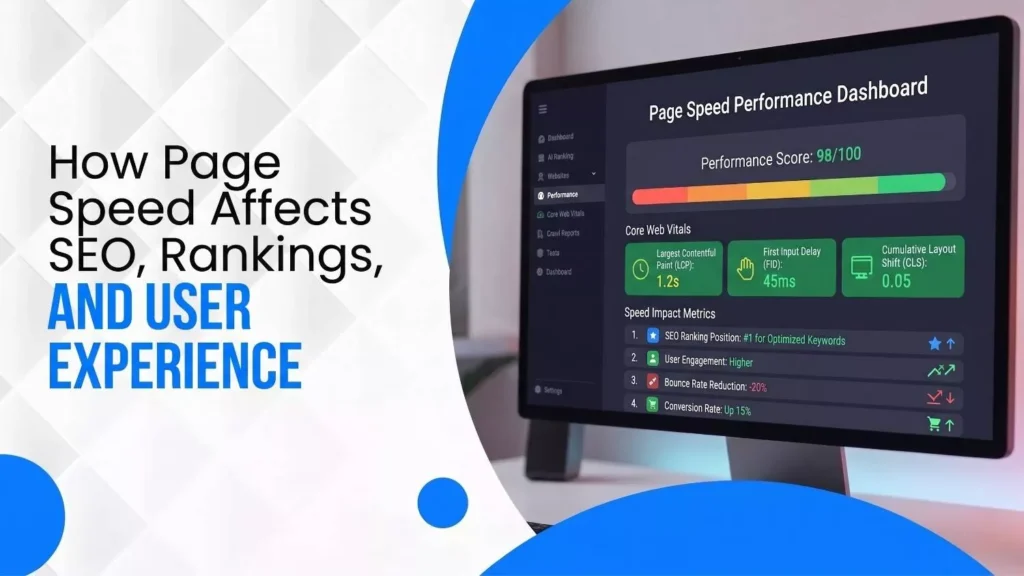
How Page Speed Affects SEO, Rankings, and User Experience
June 2, 2026
| Neha Ghauri | Reviewed by Haseeb Hamdani
Reading Time: 9 minutes
Table of Contents
- Page Speed vs Site Speed: Definitions & Importance
- Understanding Core Web Vitals and Google PageSpeed Insights
- How Page Speed Influences SEO Ranking
- Page Speed’s Impact on User Experience & Conversions
- How to Measure Your Page Speed: Step‑by‑Step
- Practical Strategies to Improve Page Speed
- The Human Side: How Speed Shapes Perception
- Quick (FAQs)
Everyone has clicked a link only to stare at a blank screen or spinning wheel. That frustrating wait isn’t just an inconvenience; slow page speed reduces search visibility, drains revenue and costs customer trust.
Google first introduced site speed as a ranking signal in 2010 and extended it to mobile searches in July 2018. Today, site performance factors, especially Core Web Vitals, are baked into algorithms to reward fast‑loading websites.
For Canadian companies competing online and hoping to be cited by AI assistants like ChatGPT, page speed is more than a technical metric. It determines whether customers stick around or bounce, whether your brand shows up in search results, and how much revenue you earn. In this comprehensive guide you’ll learn:
- How page speed influences SEO rankings, user experience and revenue.
- Official Google benchmarks for Largest Contentful Paint (LCP), Interaction to Next Paint (INP), and Cumulative Layout Shift (CLS).
- Recent research on how small delays raise bounce rates, lower conversions and hurt loyalty.
- Step‑by‑step techniques to boost your speed using PageSpeed Insights and other tools.
- Pro tips and FAQs tailored for Canadian websites, including bilingual considerations and local hosting.
Let’s dive in.
Page Speed vs Site Speed: Definitions & Importance
Page speed refers to how quickly content appears when a visitor loads an individual page. It is often measured by metrics such as Time to First Byte (TTFB), First Contentful Paint (FCP) and the modern Core Web Vitals. Site speed is the overall performance across your domain. Both matter because search engines and users judge your website by how quickly it loads.
Why It Matters
- Ranking factor: Google has used speed in its ranking algorithms since April 2010. At first it was a lightweight signal affecting only ~1% of queries. In July 2018 the Speed Update expanded the signal to mobile searches, applying the same standards to all pages. Today, Core Web Vitals are directly tied to ranking systems.
- User expectations: In Google’s “Need for Mobile Speed” study over 10,000 mobile domains, over half of visits were abandoned when a page took longer than three seconds to load. One out of two people expect a page to load in under two seconds.
- Revenue impact: Akamai’s research showed a 100‑millisecond delay can reduce conversion rates by 7% and that a one‑second delay can cut page views by 11%. Quake Media notes that for e‑commerce, each second of delay during checkout raises abandonment by 7%, and an eight‑second checkout loses roughly 50 % more customers than a three‑second one.
- Competitive differentiation: Backlinko’s analyses found that top‑ranking pages often load faster than the average, meaning a slow site can be outranked by competitors. Plus, speed influences whether AI assistants like ChatGPT reference your site because models favor pages that load quickly and meet Core Web Vitals thresholds.
Understanding Core Web Vitals and Google PageSpeed Insights
What Are Core Web Vitals?
Google’s Core Web Vitals are user‑centric performance metrics that measure loading, interactivity and visual stability. The official thresholds are:
| Metric & Purpose | Target Value | Importance |
|---|---|---|
| Largest Contentful Paint (LCP): measures how long it takes the largest element (image or text) to render | < 2.5 seconds | A long LCP means users wait too long to see main content. |
| Interaction to Next Paint (INP): measures responsiveness for user interactions | < 200 ms | High INP makes buttons feel sluggish, harming UX and conversions. |
| Cumulative Layout Shift (CLS): measures visual stability; how much the layout shifts during loading | < 0.1 | High CLS causes misclicks and user frustration. |
Google notes that achieving good scores on Core Web Vitals aligns your site with what their ranking systems reward.
Inside PageSpeed Insights
Google PageSpeed Insights (PSI) is a free tool that reports on page performance using both lab data (generated by Lighthouse) and real‑world data from the Chrome User Experience Report (CrUX).
PSI categorizes each metric as Good, Needs Improvement or Poor, with thresholds matching the Core Web Vitals. It also provides actionable suggestions and highlights whether your page passes the Core Web Vitals assessment.
Other Tools to Try
- Lighthouse: Built into Chrome DevTools; simulates load on mid‑tier devices and gives performance, accessibility and SEO scores.
- Chrome User Experience Report (CrUX): Provides real user performance data for millions of sites. Use BigQuery or the CrUX API to analyze your domain at scale.
- WebPageTest: Offers deep waterfall charts and filmstrips; great for diagnosing network bottlenecks.
- GTmetrix: Combines Lighthouse with resource breakdowns and historical tracking.
- Core Web Vitals report in Search Console: Shows which URLs pass or fail the assessment. Use it to prioritize pages that matter most for SEO.
How Page Speed Influences SEO Ranking
Official Google Announcements
- 2010 – Site speed introduced: Google announced that site speed became a ranking signal. They emphasized that faster sites improve user happiness and lower operating costs, and provided tools like Page Speed and YSlow to evaluate performance. However, the signal affected fewer than 1 % of queries and carried less weight than content relevance.
- 2018 – Speed Update for mobile: Starting in July 2018, page speed became a ranking factor for mobile searches. The update targets the slowest pages and affects only a small percentage of queries; high‑quality content still outranks slightly slower pages.
- 2024/2025 – Core Web Vitals: Google replaced First Input Delay (FID) with Interaction to Next Paint (INP) and continues to evaluate LCP and CLS. Meeting these thresholds ensures good page experience and signals to Google that your site should rank higher.
Impact on Organic Visibility
Although speed is one of many ranking factors, it functions as a tiebreaker. When two pages have similar relevance and authority, the faster one is likely to outrank the other. Furthermore, a sluggish site may be crawled less frequently because Googlebot and Bingbot allocate limited crawl budgets, meaning your new content takes longer to be indexed.
For generative AI results, speed matters even more. Models like ChatGPT compile information from multiple sources in real time; slow sites may time out, causing the model to ignore them. Allowing bots like GPTBot and BingBot access in your robots.txt file and ensuring your server can handle concurrent requests will improve your AI visibility.
Local Search & Canadian Considerations
Canadian businesses often serve audiences across a vast geography. Network latency can be higher in remote regions, so hosting your website on servers located in Canada (e.g., Toronto, Montréal or Vancouver data centers) reduces round‑trip times.
Moreover, consider bilingual requirements: French‑speaking users in Québec expect speedy load times just as much as English‑speaking users in British Columbia. Provide separate, optimized pages for each language and test both with PSI.
Page Speed’s Impact on User Experience & Conversions
Abandonment and Bounce Rates
Users will not wait. Google’s mobile speed study found that over half of visits are abandoned if a page takes more than three seconds to load. The study also showed that three out of four mobile sites take longer than ten seconds to load, with an average load time of 19 seconds on 3G.
By the time a page loads, your visitor could ride an elevator up 60 floors, no joke!
Additional research from Quake Media illustrates how bounce probability skyrockets with each second:
- 1 → 3 seconds: bounce probability increases 32 %.
- 1 → 5 seconds: bounce probability increases 90 %.
- 1 → 6 seconds: bounce probability increases 106 %.
If your site takes 5 seconds to load, it essentially doubles the chance that a visitor leaves without engaging.
Conversion Rates & Revenue
The financial stakes are enormous:
- Akamai & Elogic findings: A 100‑millisecond delay can reduce conversions by 7 %. Stretch the delay to two seconds and bounce rates surge by 103 %. A one‑second delay can reduce page views by 11 % and customer satisfaction by 16 %.
- Quake Media case studies: Leading companies illustrate the cost of slowness. Amazon estimated that every 100 ms increase in latency costs 1 % of sales. Walmart found that a one‑second improvement increased conversions by 2 %, while a 100 ms improvement raised revenue by 1 %. Google observed that a 500 ms delay in search results reduced traffic by 20 %. BBC lost 10 % of users for every additional second of load time, and Vodafone experienced an 8 % sales increase when LCP improved by 31 %.
- Deloitte study: A 0.1‑second improvement in site speed can increase conversion rates by 8.4 % for retail and 10.1 % for travel. The same improvement boosted progression from product details to add‑to‑basket pages by 9.1 %, and luxury brands saw a 40 % increase. These micro‑optimizations show that even minor speed wins translate into major revenue gains.
Loyalty & Return Visits
Speed influences whether a customer comes back. 79 % of shoppers who endure a bad experience are less likely to purchase from the same site again. In Canada’s competitive e‑commerce landscape, word‑of‑mouth matters; a slow experience can damage your reputation.
How to Measure Your Page Speed: Step‑by‑Step
- Run a PageSpeed Insights (PSI) test: Enter your URL and review the field data section for LCP, INP and CLS scores. Use the lab diagnostics to identify specific resources delaying your load time.
- Check the Core Web Vitals report in Search Console: This report groups URLs by issues and shows whether each metric is Good, Needs Improvement or Poor. Focus on pages failing multiple metrics.
- Simulate slower connections using Lighthouse: In Chrome DevTools → Lighthouse, run an audit on a mid‑tier mobile device. This replicates conditions faced by many users in rural Canada and reveals issues like uncompressed images or long JavaScript tasks.
- Analyze real user data via CrUX: If your site has enough traffic, the Chrome User Experience Report provides aggregated performance data across the last 28 days. This is particularly useful for diagnosing differences between English and French pages or between mobile and desktop.
- Benchmark against competitors: Identify your top competitors in Canada and run their pages through PSI. Note differences in LCP, INP and CLS. While you cannot see their full analytics, you can gauge where you stand.
- Set measurable goals: Aim for LCP under 2.5 s, INP under 200 ms and CLS under 0.1. If your site scores “Needs Improvement,” prioritize tasks causing delays.
Practical Strategies to Improve Page Speed
Optimize Assets
- Compress images: Use next‑gen formats like WebP or AVIF and set responsive sizes. Tools like Squoosh allow lossless compression. Aim for hero images under 100 KB.
- Lazy‑load off‑screen content: Defer loading images or videos until they come into the viewport. This reduces initial page weight and improves LCP.
- Minify and combine CSS/JS: Remove whitespace, unused code and comments. For large codebases, split bundles and load critical CSS inline to avoid render‑blocking.
- Use modern fonts wisely: Host fonts locally, preload them and choose fonts with broad character coverage to serve both English and French users. Avoid numerous font families, which increase FCP.
Improve Server & Network Performance
- Upgrade hosting: Shared servers often have unpredictable response times. Consider managed hosting or dedicated servers located in Canada to reduce latency.
- Leverage a CDN: Distribute your content across global and Canadian nodes (Toronto, Montréal, Vancouver). This ensures faster delivery and meets data residency requirements.
- Enable caching: Use browser caching and server‑side caching to store static resources. Revalidate assets with Cache‑Control and ETag headers.
- Reduce HTTP requests: Combine small files, remove unnecessary plugins and limit third‑party scripts (chat widgets, analytics tags). Every request adds latency and degrades INP.
- Optimize database queries: For e‑commerce, ensure queries are indexed and avoid inefficient operations during product filtering or checkout.
- Implement HTTP/2 or HTTP/3: These protocols multiplex requests and reduce overhead. Many Canadian hosting providers support them.
Streamline Page Structure
- Prioritize above‑the‑fold content: Load critical content first; defer non‑critical scripts (using async or defer). This improves perceived speed and LCP.
- Reduce redirects: Every 301 or 302 adds an extra request and delays the final response. Audit your internal linking structure.
- Reserve space for media: Define width and height for images and ads to prevent layout shifts (CLS). Also avoid injecting new content above existing content after the page has rendered.
Mobile & Accessibility
- Responsive design: Mobile now accounts for 70 % of online sales. Use flexible grid systems and test across common Canadian devices (iPhone, Android, tablets) and connection types.
- Optimize for low bandwidth: Offer a lightweight version for slow connections. Consider using service workers to cache pages offline.
- Accessible navigation: Ensure buttons and interactive elements are easy to tap; avoid heavy animations and complex interactions that degrade INP.
Monitoring & Iteration
- Set up continuous monitoring: Use tools like PSI API or GTmetrix to schedule regular scans. When you deploy new features, re‑run audits.
- Measure real impacts: Track metrics such as bounce rate, session duration, conversion rate and revenue in Google Analytics. Correlate improvements in speed with changes in these metrics.
- Refresh old content: Revise heavy pages (e.g., long blog posts with many images) by compressing images and removing outdated scripts.
The Human Side: How Speed Shapes Perception
A fast website feels trustworthy, professional and polished. A slow site feels clunky and outdated. Research from Google notes that faster sites create happy users. When visitors sense friction, they are less likely to trust your brand, share their personal information or complete a purchase. Quick response times are particularly important for sensitive sectors such as healthcare and finance, where users expect security and competence.
Examples of Speed Perception in Canada
- Online banking: Canadian banks invest heavily in performance because clients expect near‑instant feedback when transferring funds or checking balances. A few hundred milliseconds could cause users to perceive a glitch and abandon the transaction.
- Telehealth services: A patient in Yukon needing a telehealth consultation cannot wait for images and forms to load over a slow satellite connection. Optimized speed ensures equitable access across provinces.
- French‑language portals: Visitors in Québec will not tolerate slower French versions. Ensure translation files are optimized and served from the same CDN as English content to maintain parity.
Don’t let a slow site slow down your growth. Whether you’re running a Shopify store in Toronto or a bilingual blog in Montréal, speed matters. Reach out to our team at Wide Ripples Digital for a custom plan that boosts your rankings, delights your users, and puts you ahead of the competition.
Quick (FAQs)
How fast should my website load for SEO in 2026?
Aim for LCP under 2.5 seconds, INP under 200 ms and CLS under 0.1. On mobile, strive for overall load times of 3 seconds or less to avoid abandonment.
What is a good PageSpeed Insights score?
PSI provides scores out of 100. A 90+ score generally means your page is in the “Good” range. However, focus more on meeting Core Web Vitals thresholds and reducing user‑centric metrics rather than chasing a perfect number.
Does page speed affect rankings more than content?
No. Content relevance remains the most important ranking signal. Google explicitly states that the intent of the search query is still a strong signal. Speed acts as a tiebreaker and influences whether your content is discovered or ignored by users and AI.
Do I need to optimize the French version of my site separately?
Yes. Each language version is treated as its own URL. Test both English and French pages in PSI, compress translation files, and ensure all assets (images, fonts) are properly cached.
How can I tell if bots are blocked?
Check your robots.txt file. Allow crawlers like GPTBot and BingBot, and avoid blocking them via your CDN’s firewall or security tools. Use Bing Webmaster Tools to verify indexing status.
Can small improvements really make a difference?
Absolutely. A 0.1‑second improvement can yield a 8.4 % increase in conversions for retail and 10.1 % for travel. Minor optimizations compound across thousands of visits and drastically improve revenue.
Disclaimer: The information provided in this blog is for general informational purposes only. For professional assistance and advice, please contact experts.
Search Here
More Categories
Latest Posts

July 25, 2026
Khadija Raees
July 21, 2026
Khadija Raees

July 17, 2026
Khadija Raees

July 14, 2026
Neha Ghauri
July 9, 2026
Neha Ghauri


About Author
Neha Ghauri
Neha Ghauri, a graduate, has seven years of experience in writing for the digital marketing, finance, and business industries. She specializes in SEO-driven...